Work time
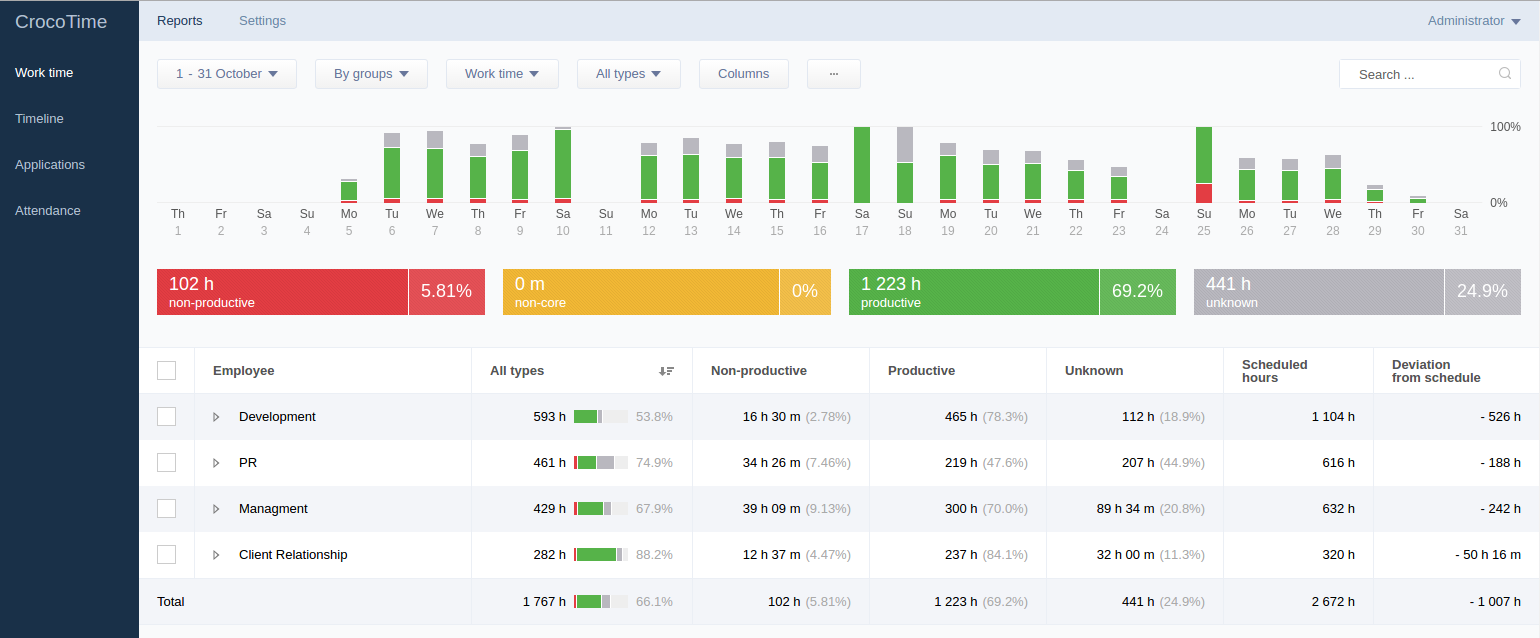
Tab Reports → Work time displays statistics showing how time is spent by every employee, in form of diagrams.

Bar diagram which displays activities of employees on daily basis is shown in the top of the screen. The bars consist of several parts of different colors to visually indicate amounts of Productive, Non-core (when it is enabled, see item 7.1.4 for details), Non-productive, and Unknown time in relation to total work time. The meaning of each color is displayed as a hint when hovering the mouse over a bar. Each bar represents one work day. Crosshatched bars represent current (unfinished) day.
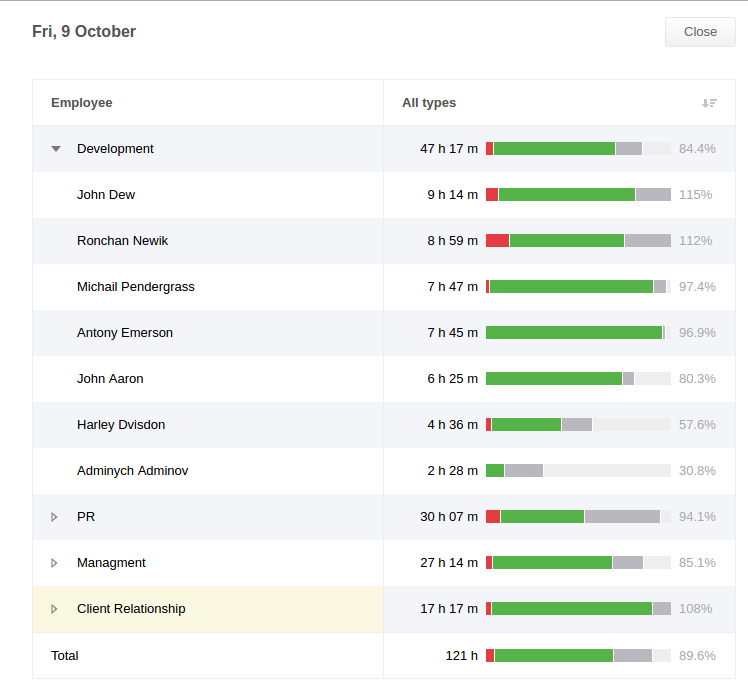
By clicking on a bar a user can see more detailed statistics for a chosen day where time worked by departments and individual employees is presented as bar diagrams and figures. The bars are also divided in colors. The list is sorted by descending work time of departments (with employees sorted within departments) by default.

The value in percent next to an employee’s bar means the percentage of time worked by the employee from the nominal amount of work time set by the employee’s schedule.
The list of all employees divided by departments is located below. The columns next to the names of employees display more detailed information about time spent by each employee.

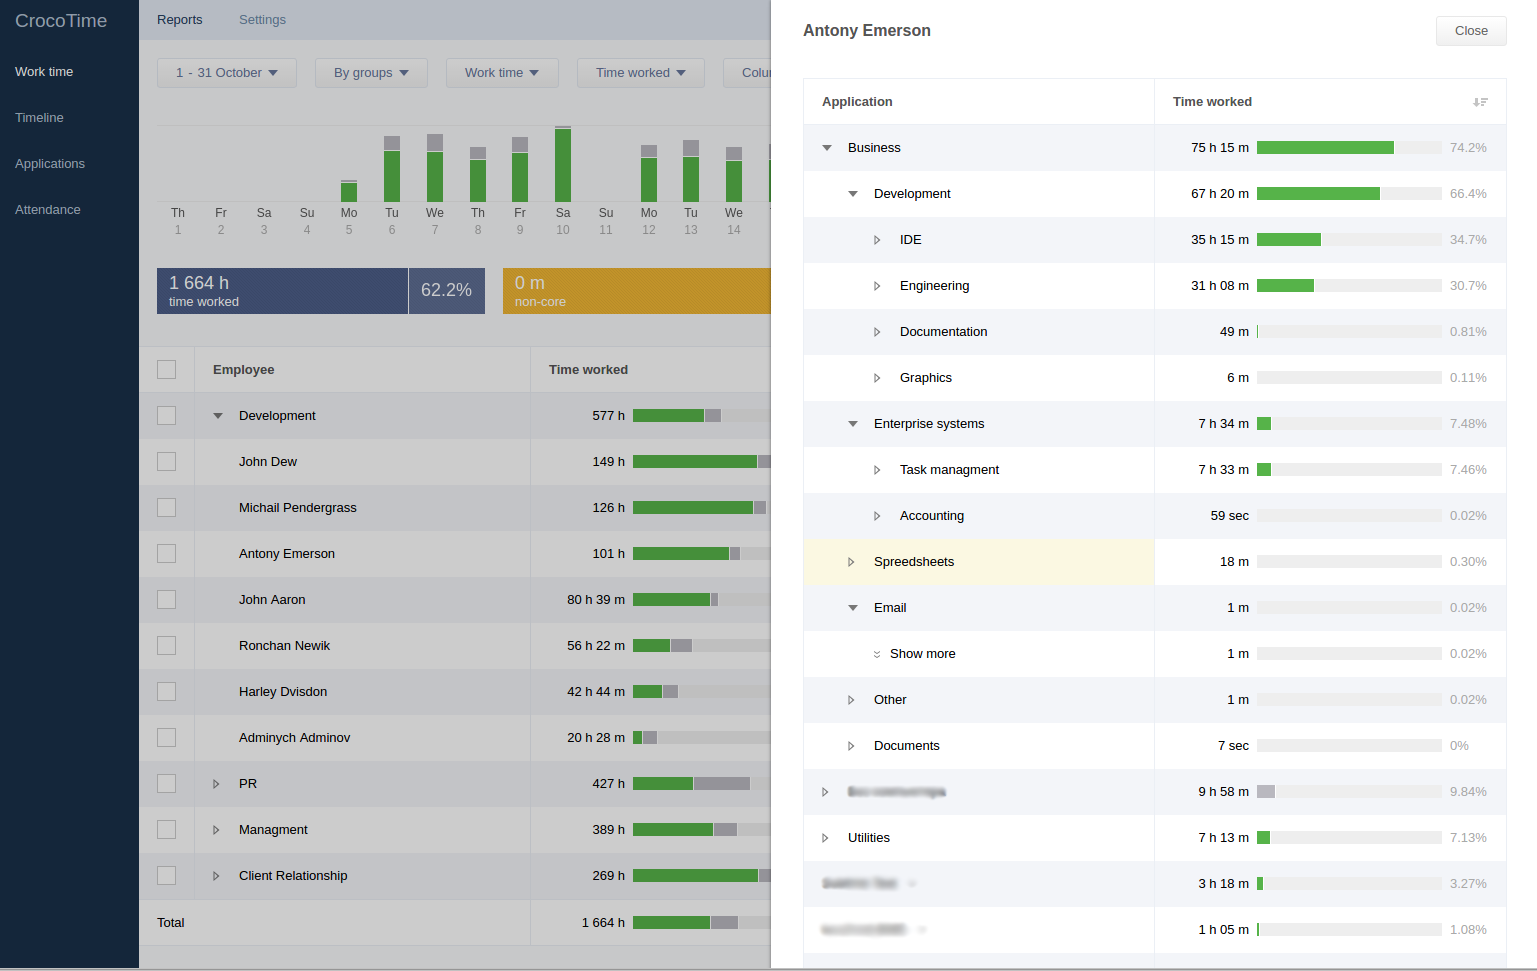
The column Time worked contains the bar divided in colors which displays ratios of time types to total time worked. The total amount of time worked during the selected time period is shown to the left of the bar and the percentage value of the ration between worked time to scheduled time is displayed to the right. The window with detailed information about an employee's activity is displayed when clicking on the bar.

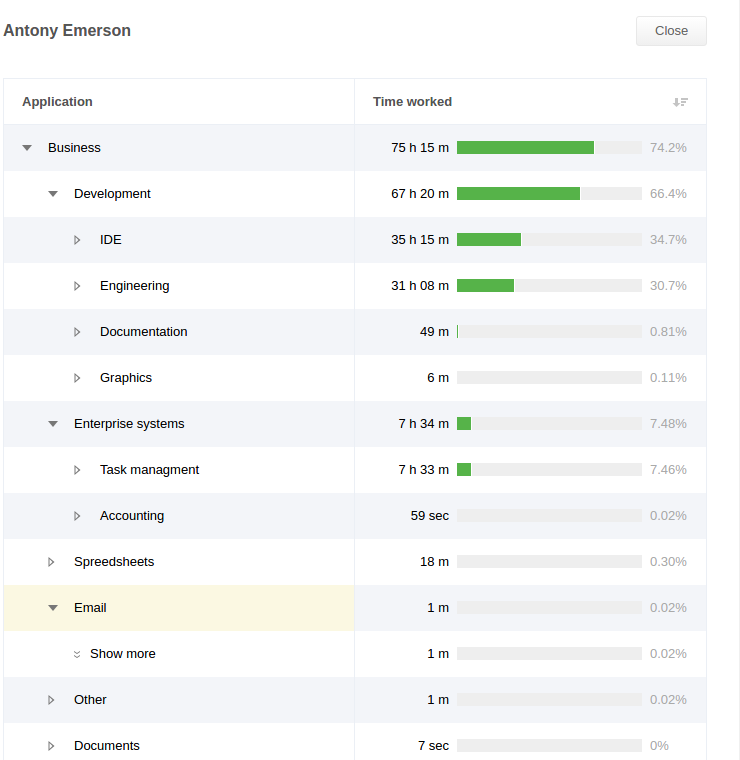
The column next to the bars shows the amount of time of this type and percentage of this time to total work time. By clicking on a bar you can see how the displayed period of time was spent (which websites and applications were used).
The table is sorted either by the amount of time or by percentage. To change the type of sorting click the header of the table.
Other buttons of the horizontal menu allow to change representation of the table.
The date button opens the Time period menu where the period of time the activity for which is displayed in the table can be selected. If several days are selected the bar diagram displays a bar for every day and if only one day is selected each bar represents one hour of time during the chosen day.

The By groups / Rating switch is used to switch the table from displaying the list of employees grouped by departments to flat list and back. When Rating is selected the list will be sorted without taking employees’ departments into account.
The Work time / Scheduled hours / Non-scheduled hours switches the table between displaying total work time to scheduled work time (work time within a work schedule) to non-scheduled time (work time outside of work schedule). This switch is displayed only if Track scheduled time separately is enabled. See item 7.1.3. for details.
The All types / Computer / Non-computer switches the table between displaying total work time to only displaying computer time to non-computer time.
The Columns button allows to choose which columns will be displayed in the table.
The Export button allows to save statistics to a computer in printable form. The downloaded file is an .xls table. Information about all employees is saved by default. To save information about specific employees only select them in the table before clicking the Export button.
